作者:俊欣
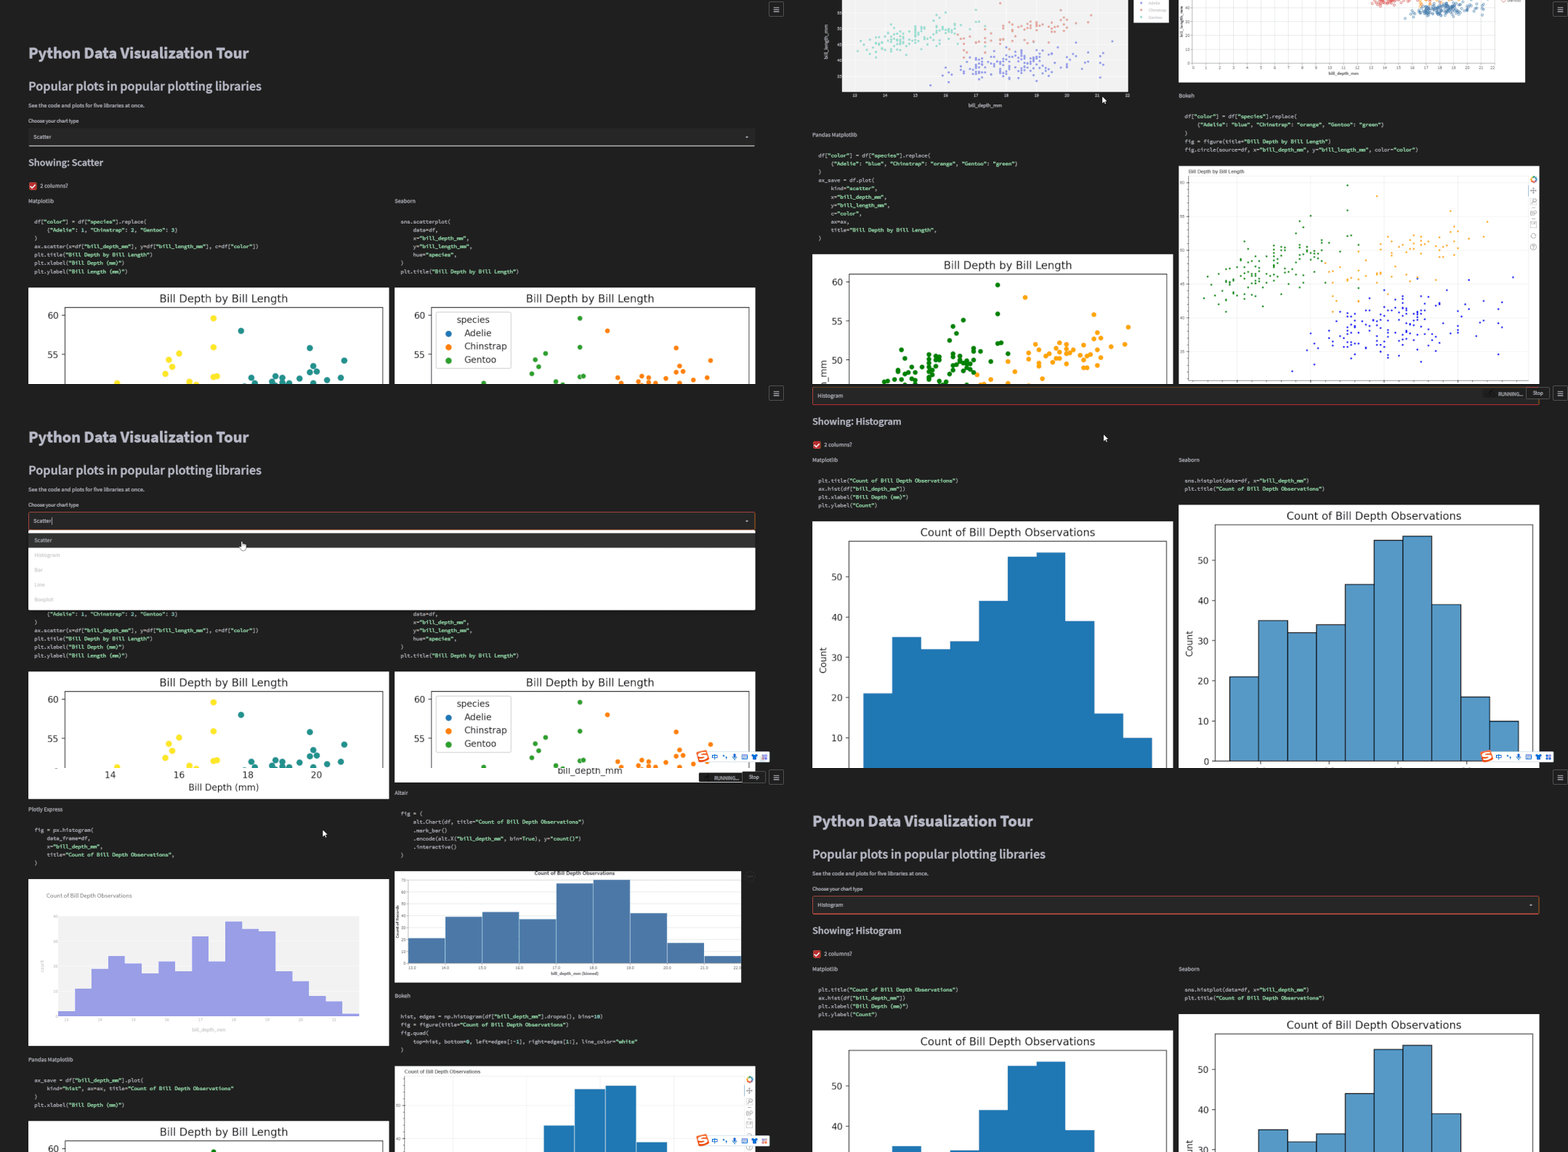
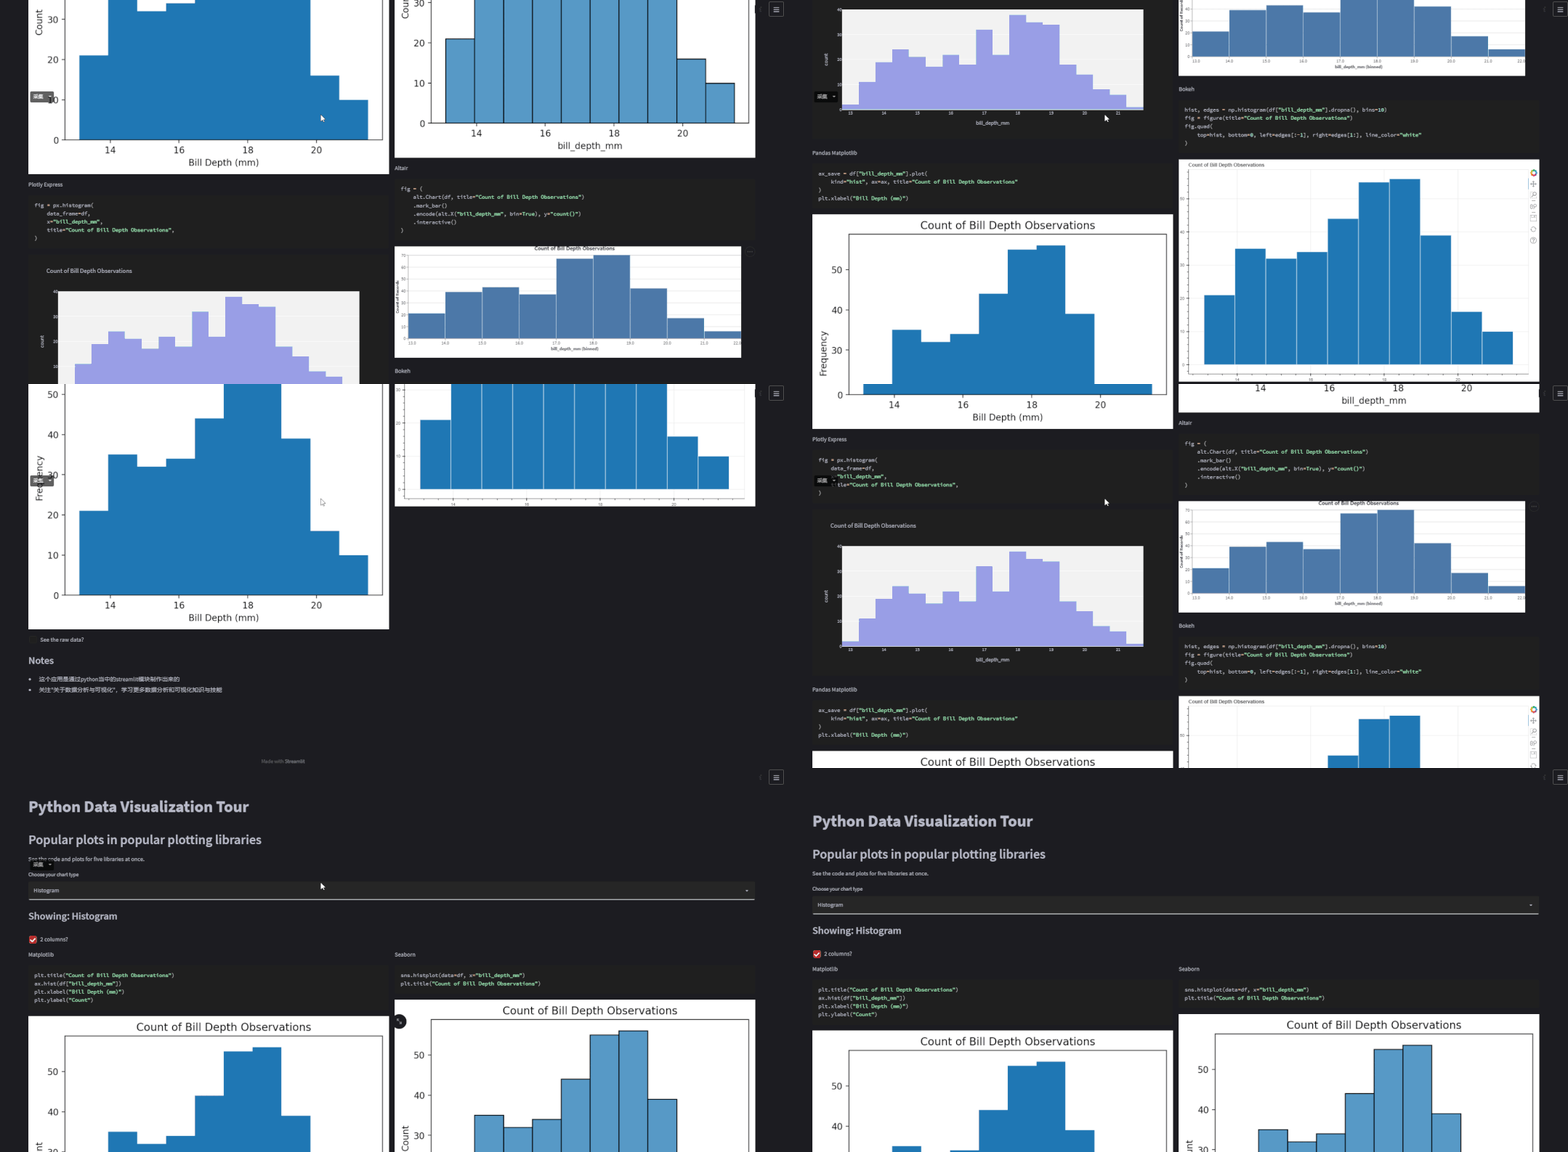
今天小编总结归纳了若干个常用的可视化图表,并且通过调用plotly、matplotlib、altair、bokeh和seaborn等模块来分别绘制这些常用的可视化图表,最后无论是绘制可视化的代码,还是会指出来的结果都会通过调用streamlit模块展示在一个可视化大屏,出来的效果如下图所示

那我们接下去便一步一步开始可视化大屏的制作吧!
标题、副标题以及下拉框
首先我们对标题、副标题部分的内容,代码如下
with st.container(): st.title("Python可视化合集") st.header("经典常用的Python可视化模块") st.write("""包括代码和可视化图表展示""")然后便是下拉框的制作,代码如下
plot_types = ( "Scatter", "Histogram", "Bar", "Line", "Boxplot")# 选择绘制的图表种类chart_type = st.selectbox("Choose your chart type", plot_types)with st.container(): st.subheader(f"Showing: {chart_type}") st.write("")对于图表的展示可以选择是“双排式”的,如下图所示

也可以选择是沉浸式的,也即是“单排式”的,如下图所示

代码如下
two_cols = st.checkbox("2 columns?", True)if two_cols: col1, col2 = st.columns(2) # 展示图表if two_cols: with col1: show_plot(kind="Matplotlib") with col2: show_plot(kind="Seaborn") with col1: show_plot(kind="Plotly Express") with col2: show_plot(kind="Altair") with col1: show_plot(kind="Pandas Matplotlib") with col2: show_plot(kind="Bokeh")else: with st.container(): for lib in libs: show_plot(kind=lib)对于双排式的展示方式而言,col1也就是左边,放置的是matplotlib、plotly、以及pandas绘制出来的图表,右边也就是col2也就是右边,放置的是seaborn、altair以及bokeh绘制出来的图表,而上述代码中调用的show_plot()函数代码如下
# 生成图表def show_plot(kind: str): st.write(kind) if kind == "Matplotlib": plot = matplotlib_plot(chart_type, df) st.pyplot(plot) elif kind == "Seaborn": plot = sns_plot(chart_type, df) st.pyplot(plot) elif kind == "Plotly Express": plot = plotly_plot(chart_type, df) st.plotly_chart(plot, use_container_width=True) elif kind == "Altair": plot = altair_plot(chart_type, df) st.altair_chart(plot, use_container_width=True) elif kind == "Pandas Matplotlib": plot = pd_plot(chart_type, df) st.pyplot(plot) elif kind == "Bokeh": plot = bokeh_plot(chart_type, df) st.bokeh_chart(plot, use_container_width=True)是一系列if...else...的判断,当绘制图表的模块是matplotlib时就调用对应的matplotlib_plot()函数,当绘制图表的模块是seaborn时就调用对应的sns_plot()函数,依次同理。我们来看其中一个函数sns_plot()的具体逻辑,代码如下
def sns_plot(chart_type: str, df): """ 生成seaborn绘制的图表 """ fig, ax = plt.subplots() if chart_type == "Scatter": with st.echo(): sns.scatterplot( data=df, x="bill_depth_mm", y="bill_length_mm", hue="species", ) plt.title("Bill Depth by Bill Length") elif chart_type == "Histogram": with st.echo(): sns.histplot(data=df, x="bill_depth_mm") plt.title("Count of Bill Depth Observations") elif chart_type == "Bar": with st.echo(): sns.barplot(data=df, x="species", y="bill_depth_mm") plt.title("Mean Bill Depth by Species") elif chart_type == "Boxplot": with st.echo(): sns.boxplot(data=df["bill_depth_mm"].dropna()) plt.title("Bill Depth Observations") elif chart_type == "Line": with st.echo(): sns.lineplot(data=df, x=df.index, y="bill_length_mm") plt.title("Bill Length Over Time") return fig其实也是一系列if...else...的判断,当所要绘制的图表是散点图时,调用的是sns.scatterplot()函数,所要绘制的是直方图时,调用的是sns.histplot(),绘制的柱状图或者是折线图时也是同理
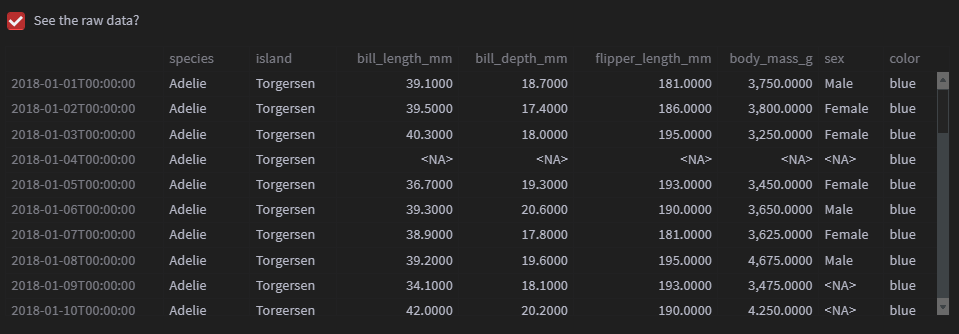
最后要是我们想要查看源数据时,也可以查看,代码如下
# 展示源数据with st.container(): show_data = st.checkbox("See the raw data?") if show_data: df # 要点 st.subheader("Notes") st.write( """ - 这个应用是通过python当中的streamlit模块制作出来的 - 关注"关于数据分析与可视化",学习更多数据分析和可视化知识与技能 """ )output

 鲁公网安备37020202000738号