掌握 Golang 程序性能分析:pprof 工具使用指南(二)
发表时间: 2023-01-17 21:44
Go 在 1.11 版本后自带的工具集 go tool 里面内置了 pprof 命令行工具来分析由 pprof 库生成的数据文件。
pprof 工具既可以基于 http 接口进行性能分析也可以基于文件进行分析,提供了两种分析模式
接下来分别看下这两种方式是怎么操作的。
在交互模式里 pprof 提供了很多分析各类指标的子命令,在交互模式下输入 help 后就会列出所有子命令,可以自己多多探索。本文以 cpu 分析为例进行讲解。
基于 http 接口的数据分析,执行如下命令后,会采集默认30秒之后的cpu数据,然后生成记录进行数据分析。可以通过传入seconds来指定秒数:
go tool pprof http://localhost:8000/debug/pprof/profile基于文件进行分析:
go tool pprof /your/path/xxx为了可以很好地看出效果,使用如下 http 服务来做性能分析:
package mainimport ( "fmt" "math/rand" "net/http" _ "net/http/pprof")func bubbleSort(nums []int) []int { length := len(nums) for i := 0; i < length-1; i++ { for j := i + 1; j < length; j++ { if nums[i] > nums[j] { nums[i], nums[j] = nums[j], nums[i] } } } return nums}func main() { http.HandleFunc("/", func(w http.ResponseWriter, r *http.Request) { arr := make([]int, 100) for i := 0; i < 100; i++ { arr[i] = rand.Intn(100) } for i := 0; i < 10000; i++ { bubbleSort(arr) } w.Write([]byte("complete sort")) }) if err := http.ListenAndServe(":8000", nil); err != nil { fmt.Println("start http server fail:", err) }}启动服务后,执行 go tool pprof http://localhost:8000/debug/pprof/profile,等30秒(期间访问几次 http://localhost:8000,一定要做这个动作)后进入交互模式。使用 top 命令查看耗时最长的一些方法:
(pprof) topShowing nodes accounting for 3430ms, 99.42% of 3450ms totalDropped 16 nodes (cum <= 17.25ms) flat flat% sum% cum cum% 3270ms 94.78% 94.78% 3330ms 96.52% main.bubbleSort (inline) 100ms 2.90% 97.68% 100ms 2.90% runtime.mallocgc 60ms 1.74% 99.42% 60ms 1.74% runtime.asyncPreempt 0 0% 99.42% 3430ms 99.42% main.main.func1 0 0% 99.42% 3430ms 99.42% net/http.(*ServeMux).ServeHTTP 0 0% 99.42% 3430ms 99.42% net/http.(*conn).serve 0 0% 99.42% 3430ms 99.42% net/http.HandlerFunc.ServeHTTP 0 0% 99.42% 3430ms 99.42% net/http.serverHandler.ServeHTTP 0 0% 99.42% 100ms 2.90% runtime.newobject每一行都代表一个函数的信息,每列的意思如下:
flat:函数在 CPU 上运行的时间flat%:函数在CPU上运行时间的百分比sum%:是从上到当前行所有函数累加使用 CPU 的比例cum:这个函数以及子函数运行所占用的时间,应该大于等于flatcum%:这个函数以及子函数运行所占用的比例,应该大于等于flat%最后一列:函数名称list 后面加上函数名称即可查看该函数每一行的具体耗时:
(pprof) list bubbleSortTotal: 3.45sROUTINE ======================== main.bubbleSort in /Users/SM0410/project/go/gotest/learning/http.go 3.27s 3.33s (flat, cum) 96.52% of Total . . 7: _ "net/http/pprof" . . 8:) . . 9: . . 10:func bubbleSort(nums []int) []int { . . 11: length := len(nums) 270ms 280ms 12: for i := 0; i < length-1; i++ { 1.46s 1.49s 13: for j := i + 1; j < length; j++ { 1.54s 1.56s 14: if nums[i] > nums[j] { . . 15: nums[i], nums[j] = nums[j], nums[i] . . 16: } . . 17: } . . 18: } . . 19: return numspprof 还可以生成 svg 文件,打开svg文件可以查看函数间的调用关系。使用这个功能前需要安装 graphviz,安装方法如下:
Mac
brew install graphvizDebian/Ubuntu
sudo apt install graphvizCentos
sudo yum install graphvizgraphviz 安装完成后,在交互命令行执行 svg 即可
(pprof) svg Generating report in profile001.svg也可以使用 web 命令生成svg文件并自动打开浏览器查看svg
(pprof) web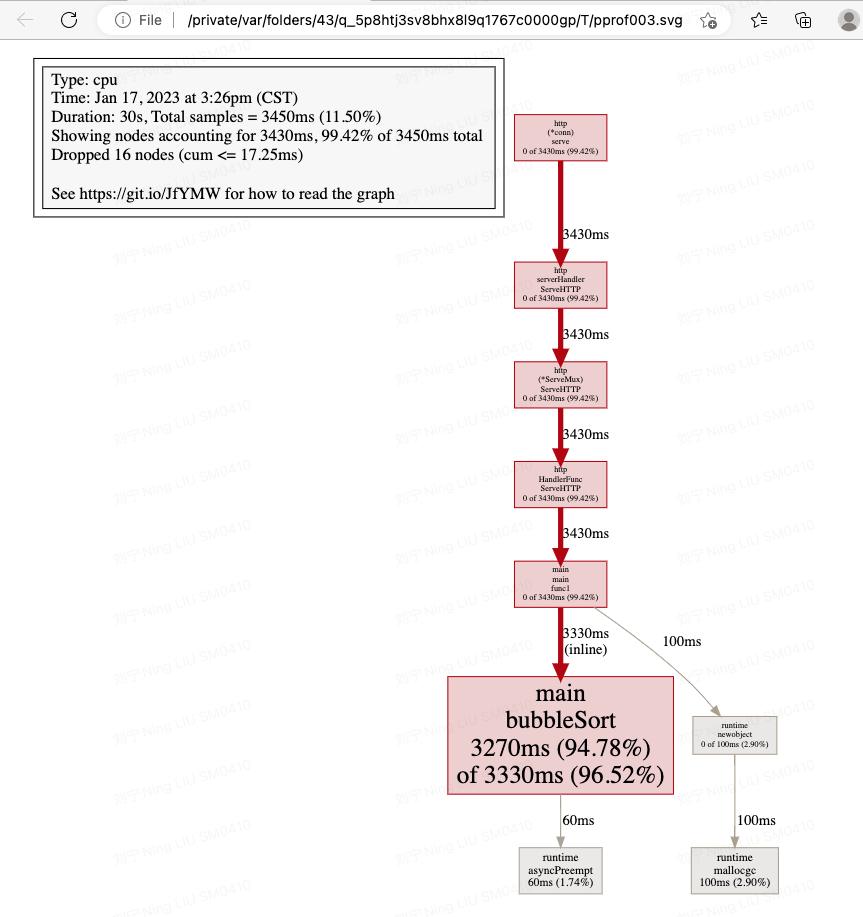
函数调用关系图
图中每个方框对应程序运行的一个函数,方框越大代表函数执行的时间越长(函数执行时间会包含它调用的子函数的执行时间,但并不是正比的关系),方框之间的箭头代表着调用关系,箭头上的数字代表被调用函数的执行时间。
执行如下命令会启动一个 http 服务器,里面提供了很多分析功能。在执行命令期间,一定要多访问几次 http://localhost:8000 :
//基于 http 接口分析go tool pprof -http=:9000 http://localhost:8000/debug/pprof/profile 基于文件分析:
go tool pprof -http=:9000 /your/path/xxx如图
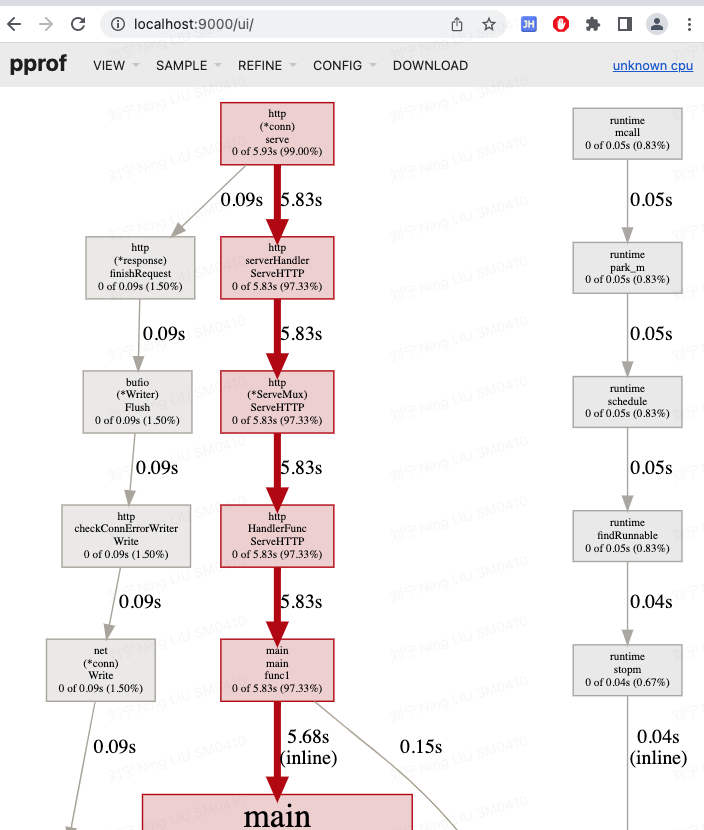
执行 go tool pprof http://localhost:8000/debug/pprof/heap 即可,其他和 cpu 分析同理。
火焰图(Flame Graph)是 Bredan Gregg 创建的一种性能分析图表,因为它的样子近似火焰而得名。上面的 profiling 结果也转换成火焰图,火焰图的调用顺序从下到上,每个方块代表一个函数,它上面一层表示这个函数会调用哪些函数,方块的大小代表了占用 CPU 使用的长短。火焰图的配色并没有特殊的意义,默认的红、黄配色是为了更像火焰而已。
在 web 模式打开的页面里面,点击 VIEW -> Flame Graph 即可看到生成的火焰图:
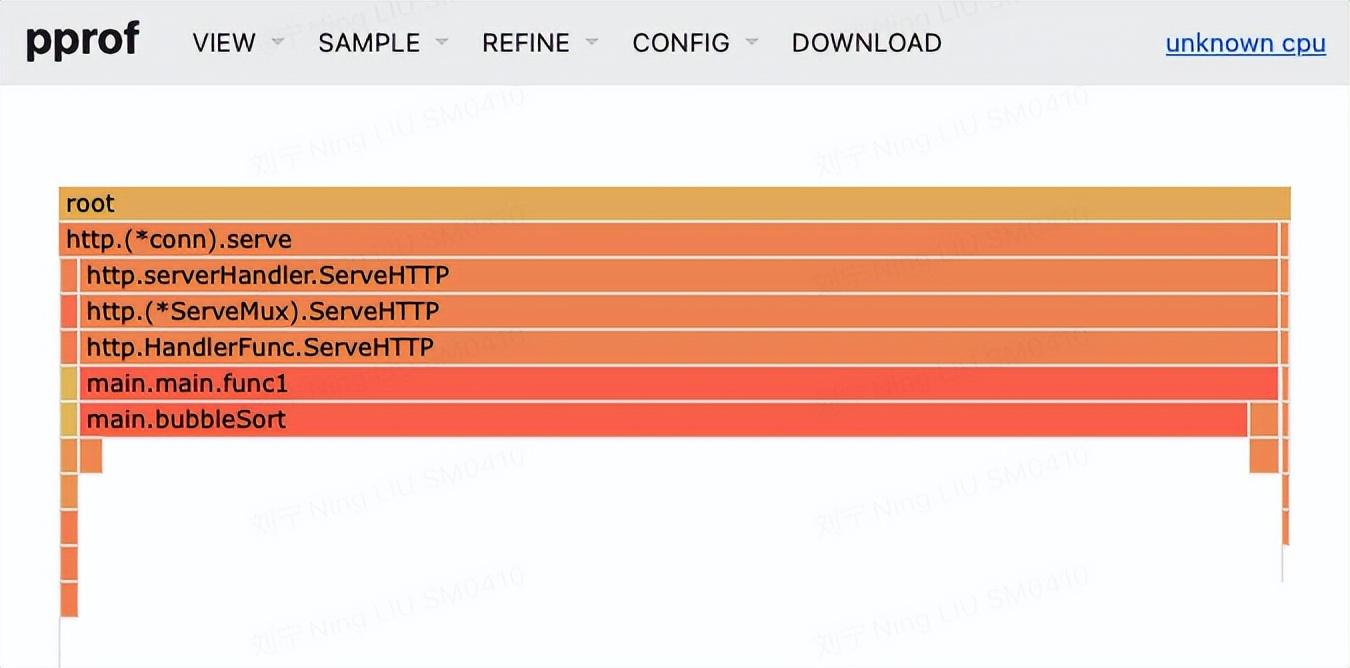
火焰图
文本讲解了 pprof 工具的使用方法,在使用 pprof 采集数据的时候要注意只有有访问量的情况下才能采集到性能指标数据。下篇文章会介绍主流框架集成 pprof 的方法。
声明:本站内容部分源于网络转载,出于传递更多信息之目的,并不意味着赞同其观点或证实其描述。文章内容仅供参考,请咨询相关专业人士。
如果无意之中侵犯了您的版权,或有意见、反馈或投诉等情况, 请联系本站,[qq:]
Copyright ©2025 编程密语 All rights reserved 版权所有 鲁ICP备09004228号-12
 鲁公网安备37020202000738号