跨平台图表解决方案:探索功能丰富的.NET开源库
发表时间: 2024-04-27 09:02
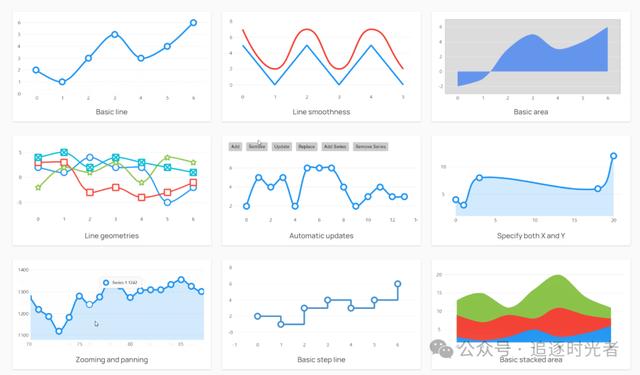
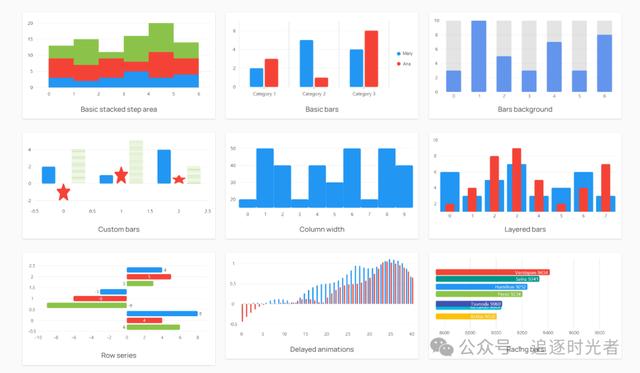
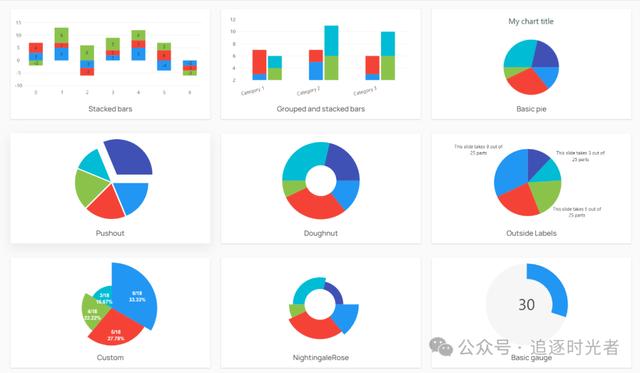
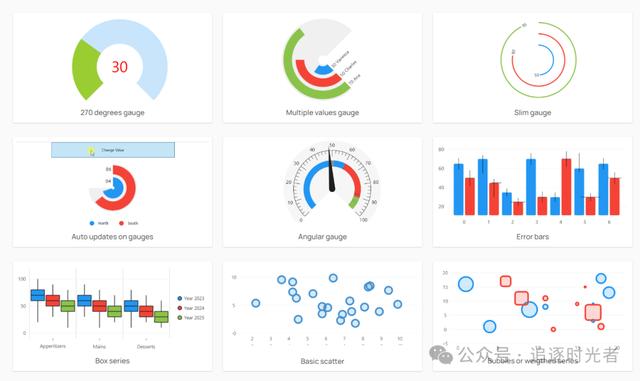
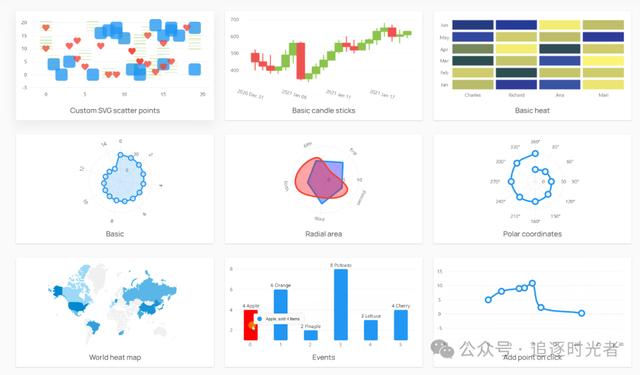
今天大姚给大家分享一个.NET开源(MIT License)、功能强大、简单、灵活、跨平台的图表、地图和仪表库:LiveCharts2。
LiveCharts2是一个.NET开源、简单、灵活、交互式且功能强大的.NET图表、地图和仪表,现在几乎可以在任何地方运行如:Maui、Uno Platform、Blazor-wasm、WPF、WinForms、Xamarin、Avalonia、WinUI、UWP。

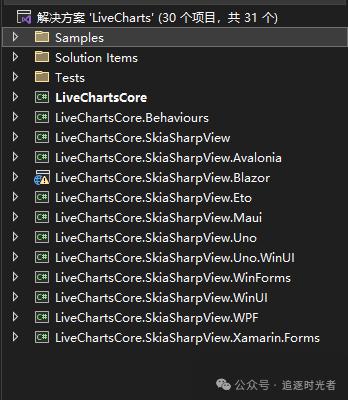
LiveChartsCore.SkiaSharpView.Blazor
using CommunityToolkit.Mvvm.ComponentModel;
using LiveChartsCore;
using LiveChartsCore.SkiaSharpView;
using LiveChartsCore.SkiaSharpView.Painting;
using SkiaSharp;
namespace ViewModelsSamples.Bars.Basic;
public partial class ViewModel : ObservableObject
{
public ISeries[] Series { get; set; } =
{
new ColumnSeries<double>
{
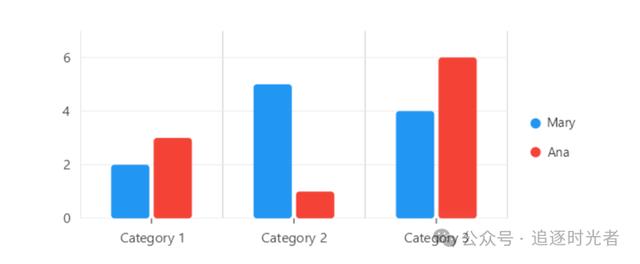
Name = "Mary",
Values = new double[] { 2, 5, 4 }
},
new ColumnSeries<double>
{
Name = "Ana",
Values = new double[] { 3, 1, 6 }
}
};
public Axis[] XAxes { get; set; } =
{
new Axis
{
Labels = new string[] { "Category 1", "Category 2", "Category 3" },
LabelsRotation = 0,
SeparatorsPaint = new SolidColorPaint(new SKColor(200, 200, 200)),
SeparatorsAtCenter = false,
TicksPaint = new SolidColorPaint(new SKColor(35, 35, 35)),
TicksAtCenter = true,
// By default the axis tries to optimize the number of
// labels to fit the available space,
// when you need to force the axis to show all the labels then you must:
ForceStepToMin = true,
MinStep = 1
}
};
}
@page "/Bars/Basic"
@using LiveChartsCore.SkiaSharpView.Blazor
@using ViewModelsSamples.Bars.Basic

<CartesianChart
 Series="ViewModel.Series"
 XAxes="ViewModel.XAxes"
 LegendPosition="LiveChartsCore.Measure.LegendPosition.Right">
</CartesianChart>

@code {
 public ViewModel ViewModel { get; set; } = new();
}
using System;
using System.Collections.Generic;
using CommunityToolkit.Mvvm.ComponentModel;
using LiveChartsCore;
using LiveChartsCore.Drawing;
using LiveChartsCore.Kernel;
using LiveChartsCore.SkiaSharpView;
using LiveChartsCore.SkiaSharpView.Drawing.Geometries;
namespace ViewModelsSamples.Bars.DelayedAnimation;
public partial class ViewModel : ObservableObject
{
public ViewModel()
{
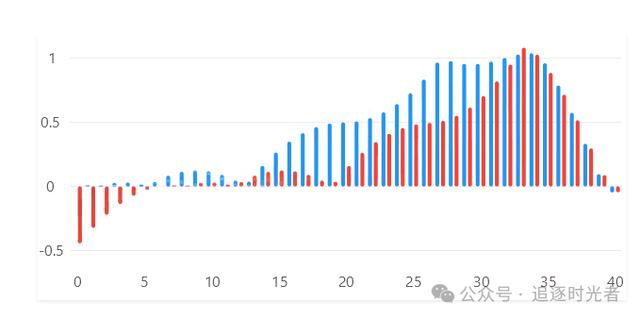
var values1 = new List<float>();
var values2 = new List<float>();
var fx = EasingFunctions.BounceInOut; // this is the function we are going to plot
var x = 0f;
while (x <= 1)
{
values1.Add(fx(x));
values2.Add(fx(x - 0.15f));
x += 0.025f;
}
var columnSeries1 = new ColumnSeries<float>
{
Values = values1,
Stroke = ,
Padding = 2
};
var columnSeries2 = new ColumnSeries<float>
{
Values = values2,
Stroke = ,
Padding = 2
};
columnSeries1.PointMeasured += OnPointMeasured;
columnSeries2.PointMeasured += OnPointMeasured;
Series = new List<ISeries> { columnSeries1, columnSeries2 };
}
private void OnPointMeasured(ChartPoint<float, RoundedRectangleGeometry, LabelGeometry> point)
{
var perPointDelay = 100; // milliseconds
var delay = point.Context.Entity.MetaData!.EntityIndex * perPointDelay;
var speed = (float)point.Context.Chart.AnimationsSpeed.TotalMilliseconds + delay;
point.Visual?.SetTransition(
new Animation(progress =>
{
var d = delay / speed;
return progress <= d
? 0
: EasingFunctions.BuildCustomElasticOut(1.5f, 0.60f)((progress - d) / (1 - d));
},
TimeSpan.FromMilliseconds(speed)));
}
public List<ISeries> Series { get; set; }
}
@page "/Bars/DelayedAnimation"
@using LiveChartsCore.SkiaSharpView.Blazor
@using ViewModelsSamples.Bars.DelayedAnimation

<CartesianChart
 Series="ViewModel.Series">
</CartesianChart>

@code {
 public ViewModel ViewModel { get; set; } = new();
}
更多项目实用功能和特性欢迎前往项目开源地址查看?,别忘了给项目一个Star支持?。
该项目已收录到C#/.NET/.NET Core优秀项目和框架精选中,关注优秀项目和框架精选能让你及时了解C#、.NET和.NET Core领域的最新动态和最佳实践,提高开发工作效率和质量。坑已挖,欢迎大家踊跃提交PR推荐或自荐(让优秀的项目和框架不被埋没?)。
声明:本站内容部分源于网络转载,出于传递更多信息之目的,并不意味着赞同其观点或证实其描述。文章内容仅供参考,请咨询相关专业人士。
如果无意之中侵犯了您的版权,或有意见、反馈或投诉等情况, 请联系本站,[qq:]
Copyright ©2024 编程密语 All rights reserved 版权所有 鲁ICP备09004228号-12


 鲁公网安备37020202000738号