在VUE.js中打造独特的echarts Geo路径图
发表时间: 2024-05-31 17:45
解决VUE.js中加入echarts中的Geo路径图(SVG)以及其他注意要点
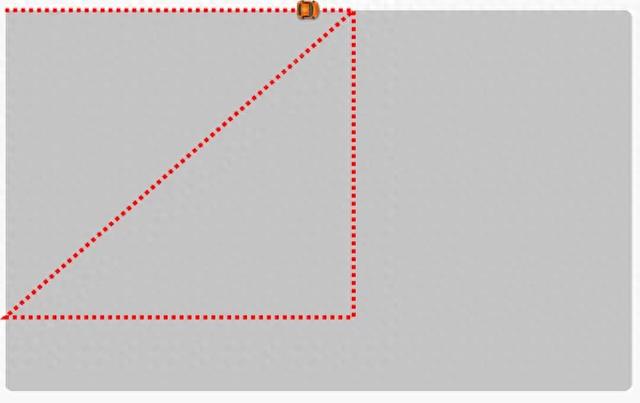
路径图,小车正在行走

小车图

SVG图,须自行转换为SVG格式
注意点:
官网给的方法 echarts.registerMap('MacOdrum-LV5-floorplan-web', { svg: svgcode });此时的svgcode为object类型的数据,如果只是svg文件路径则报错【TypeError: Cannot read properties of null (reading 'nodeName')】,因此需要引入'axios'转换格式, axios.get(‘svg文件路径地址’)
.then(response => {
debugger;
// 将SVG字符串转换为DOM对象
echarts.registerMap('BackImg', { svg: response.data });
})
.catch(error => {
console.error('Error fetching SVG:', error);
});
②需要将路径图方法都放在axios.get方法下,否则报错【Map BackImg not exists. The GeoJSON of the map must be provided.】、【TypeError: Cannot read properties of undefined (reading 'regions')】且首次载入页面时不显示svg相关信息
③SVG文件中的抬头需要去除,以<svg…开头,例如有的抬头为【<?xml version="1.0" encoding="utf-8"?>
<!-- Generator: Adobe Illustrator 16.0.0, SVG Export Plug-In . SVG Version: 6.00 Build 0) -->
<!DOCTYPE svg PUBLIC "-//W3C//DTD SVG 1.1//EN" "http://www.w3.org/Graphics/SVG/1.1/DTD/svg11.dtd">】需要去除
import * as echarts from 'echarts';
import axios from 'axios';
import { reactive, onMounted, ref, watch, nextTick, onActivated, markRaw } from 'vue';
<div style="height: 600px;width:1221px;background-repeat: no-repeat;background-size:100%;" ref="svgRef"></div>
const state = reactive({
global: {
homeChartOne: null,
homeChartTwo: null,
homeCharThree: null,
homeCharForth: null,
dispose: [null, '', undefined],
} as any,
lineArr: {},
myCharts: [] as EmptyArrayType,
charts: {
theme: '',
bgColor: '',
color: '#303133',
},
finalLine: [
[0,0], [340,0], [340,300],
[0,300], [340,0], ]
});
onMounted(async () => {
state.lineArr = state.finalLine;
svgImgChart(state.lineArr);
});
const svgImgChart = (reslut: any) => {
if (!state.global.dispose.some((b: any) => b === state.global.homeCharForth)) state.global.homeCharForth.dispose();
state.global.homeCharForth = markRaw(echarts.init(svgRef.value, state.charts.theme));
var svg = '/carInfo/BackImg.svg';// 自己的svg文件地址
axios.get(svg)
.then(response => {
debugger;
// 将SVG字符串转换为DOM对象
echarts.registerMap('BackImg', { svg: response.data });
const option = {
title: {
//text: 'Visit Route',
left: 'center',
bottom: 10
},
tooltip: {},
geo: {
map: 'BackImg',
roam: true,
emphasis: {
itemStyle: {
color: echarts.color
},
label: {
show: false
}
}
},
series: [
{
name: 'Route',
type: 'lines',
coordinateSystem: 'geo',
geoIndex: 0,
emphasis: {
label: {
show: false
}
},
polyline: true,
lineStyle: {
color: 'red', // '#c46e54',
width: 5,
opacity: 1,
type: 'dotted'
},
effect: {
show: true,
period: 8,
color: '#a10000',
constantSpeed: 80,
trailLength: 0,
symbolSize: [25, 30],// 图片大小
symbol: 'image:///carInfo/carUp.png'// 获取小轿车的图片
//'image://https://a.amap.com/jsapi_demos/static/demo-center-v2/car.png'
//'path://M35.5 40.5c0-22.16 17.84-40 40-40s40 17.84 40 40c0 1.6939-.1042 3.3626-.3067 5H35.8067c-.2025-1.6374-.3067-3.3061-.3067-5zm90.9621-2.6663c-.62-1.4856-.9621-3.1182-.9621-4.8337 0-6.925 5.575-12.5 12.5-12.5s12.5 5.575 12.5 12.5a12.685 12.685 0 0 1-.1529 1.9691l.9537.5506-15.6454 27.0986-.1554-.0897V65.5h-28.7285c-7.318 9.1548-18.587 15-31.2715 15s-23.9535-5.8452-31.2715-15H15.5v-2.8059l-.0937.0437-8.8727-19.0274C2.912 41.5258.5 37.5549.5 33c0-6.925 5.575-12.5 12.5-12.5S25.5 26.075 25.5 33c0 .9035-.0949 1.784-.2753 2.6321L29.8262 45.5h92.2098z'
},
data: [reslut],// 更新对应的数据,去除默认数据
//markPoint: {
// data: [
// { type: 'max', name: 'Max' },
// { type: 'min', name: 'Min' }
// ]
// },
// markLine: {
// data: [{ type: 'average', name: 'Avg' }]
// }
}
]
};
state.global.homeCharForth.setOption(option);
state.myCharts.push(state.global.homeCharForth);
})
.catch(error => {
console.error('Error fetching SVG:', error);
});
};
声明:本站内容部分源于网络转载,出于传递更多信息之目的,并不意味着赞同其观点或证实其描述。文章内容仅供参考,请咨询相关专业人士。
如果无意之中侵犯了您的版权,或有意见、反馈或投诉等情况, 请联系本站,[qq:]
Copyright ©2024 编程密语 All rights reserved 版权所有 鲁ICP备09004228号-12
 鲁公网安备37020202000738号